11. TLAB 相关 JVM 日志解析
11.1. 准备 Java WhiteBox API
首先需要准备好 Java WhiteBox API
11.1.1. 什么是 WhiteBox API
WhiteBox API 是 HotSpot VM 自带的白盒测试工具,将内部的很多核心机制的 API 暴露出来,用于白盒测试 JVM,压测 JVM 特性,以及辅助学习理解 JVM 并调优参数。WhiteBox API 是 Java 7 引入的,目前 Java 8 LTS 以及 Java 11 LTS(其实是 Java 9+ 以后的所有版本,这里只关心 LTS 版本,Java 9 引入了模块化所以 WhiteBox API 有所变化)都是有的。但是默认这个 API 并没有编译在 JDK 之中,但是他的实现是编译在了 JDK 里面了。所以如果想用这个 API,需要用户自己编译需要的 API,并加入 Java 的 BootClassPath 并启用 WhiteBox API。
11.1.2. WhiteBox API 如何实现的
WhiteBox API 是一个 Java 类, 位于 JDK 的测试包中,默认没有编译进标准发行版的 JDK 中 。
test/lib/sun/hotspot/WhiteBox.java
    package sun.hotspot;
    public class WhiteBox {
      //仅举两个例子,省略其他 api 以及代码
      // Force Young GC
      public native void youngGC();
      // Force Full GC
      public native void fullGC();
    }
可以看出,其实里面的所有 API 都是 JNI 调用 ,具体实现是:
src/hotspot/share/prims/whitebox.cpp
    WB_ENTRY(void, WB_FullGC(JNIEnv* env, jobject o))
      Universe::heap()->soft_ref_policy()->set_should_clear_all_soft_refs(true);
      Universe::heap()->collect(GCCause::_wb_full_gc);
    #if INCLUDE_G1GC
      if (UseG1GC) {
        // Needs to be cleared explicitly for G1
        Universe::heap()->soft_ref_policy()->set_should_clear_all_soft_refs(false);
      }
    #endif // INCLUDE_G1GC
    WB_END

    WB_ENTRY(void, WB_YoungGC(JNIEnv* env, jobject o))
      Universe::heap()->collect(GCCause::_wb_young_gc);
    WB_END

    {CC"youngGC",  CC"()V",                             (void*)&WB_YoungGC },
    {CC"fullGC",   CC"()V",                             (void*)&WB_FullGC },

    //省略其他代码
可以看出,JNI 调用实现直接调用了底层 JVM 的相关接口,相当于把 JVM 的一些关键机制暴露出来,用于白盒测试。但是如之前所说,JDK 发行版没有包括 test 下的测试代码,也就是 WhiteBox API 所在的 jar 包并没有打进默认的 JDK 中。这就需要我们自己编译一下这个代码。
11.1.3. 什么是 BootClassPath
Java 内有三种不同的类加载器: 应用类加载器 (application classloader), 扩展类加载器 (extension classloader)还有 根类加载器 (bootstrap classloader)
- 应用类加载器 ,加载我们classpath目录下的所有类文件
- 扩展类加载器 ,加载标准 Java 类库扩展的类,就是你的jre目录下的/lib/ext目录下的所有类
- 根类加载器 (bootstrap classloader),扫描 BootClassPath 下的 标准 Java 类库的类加载器。标准 Java 类库限制了一些包路径的类,必须通过 根类加载器 加载。
对于 WhiteBox API,由于是他的包为sun.hotspot,普通的类加载器是不能加载这个包路径的类的,需要通过 根类加载器 加载。
11.1.4. 怎么指定 BootClassPath
在 Java 8,通过 -Xbootclasspath: 或者 -Xbootclasspath/p:指定,例如:
    -Xbootclasspath:/home/project/whitebox.jar
    -Xbootclasspath/p:/home/project/whitebox.jar
在 Java 9 之后的版本,这两个参数已经过期了,需要改成-Xbootclasspath/a:,例如:
-Xbootclasspath/a:/home/project/whitebox.jar
否则会报错-Xbootclasspath is no longer a supported option.
这里对应的 JDK 源码是:
src/hotspot/share/runtime/arguments.cpp
    // -bootclasspath:
    } else if (match_option(option, "-Xbootclasspath:", &tail)) {
        jio_fprintf(defaultStream::output_stream(),
          "-Xbootclasspath is no longer a supported option.\n");
        return JNI_EINVAL;
    // -bootclasspath/a:
    } else if (match_option(option, "-Xbootclasspath/a:", &tail)) {
      //将参数添加到 bootclasspath 中
      Arguments::append_sysclasspath(tail);
    // -bootclasspath/p:
    } else if (match_option(option, "-Xbootclasspath/p:", &tail)) {
        jio_fprintf(defaultStream::output_stream(),
          "-Xbootclasspath/p is no longer a supported option.\n");
        return JNI_EINVAL;
    }
11.1.5. 使用 WhiteBox API
1. 编译 WhiteBox API
将https://github.com/openjdk/jdk/tree/master/test/lib路径下的sun目录取出,编译成一个 jar 包,名字假设是 whitebox.jar
2. 编写测试程序
将 whitebox.jar 添加到你的项目依赖,之后写代码
    public static void main(String[] args) throws Exception {
            WhiteBox whiteBox = WhiteBox.getWhiteBox();
            //获取 ReservedCodeCacheSize 这个 JVM flag 的值
            Long reservedCodeCacheSize = whiteBox.getUintxVMFlag("ReservedCodeCacheSize");
            System.out.println(reservedCodeCacheSize);
            //打印堆内存各项指标
            whiteBox.printHeapSizes();
            //执行full GC
            whiteBox.fullGC();

            //保持进程不退出,保证日志打印完整
            Thread.currentThread().join();
    }
3. 启动程序查看效果
使用启动参数 -Xbootclasspath/a:/home/project/whitebox.jar -XX:+UnlockDiagnosticVMOptions -XX:+WhiteBoxAPI -Xlog:gc 启动程序。其中前三个 Flag 表示启用 WhiteBox API,最后一个表示打印 GC info 级别的日志到控制台。
我的输出:
    [0.025s][info][gc] Using G1
    251658240
    Minimum heap 8388608 Initial heap 268435456 Maximum heap 4276092928 Space alignment 2097152 Heap alignment 2097152
    [0.899s][info][gc] GC(0) Pause Full (WhiteBox Initiated Full GC) 5M->0M(20M) 45.183ms
至此,我们就准备好了 WhiteBox 调试环境
11.2. 测试 TLAB 查看日志
编写测试代码:
    //对于字节数组对象头占用16字节
    private static final int BYTE_ARRAY_OVERHEAD = 16;
    //我们要测试的对象大小是100kb
    private static final int OBJECT_SIZE = 100 * 1024;
    //需要使用静态field,而不是方法内本地变量,否则编译后循环内的new byte[]全部会被省略,只剩最后一次的
    public static byte[] tmp;

    public static void main(String[] args) throws Exception {
            WhiteBox whiteBox = WhiteBox.getWhiteBox();
            //强制 fullGC 防止接下来程序发生 GC
            //同时可以区分出初始化带来的其他线程的TLAB相关的日志
            whiteBox.fullGC();
            //分配对象,大小1KB
            for (int i = 1; i < 512; ++i) {
                tmp = new byte[OBJECT_SIZE - BYTE_ARRAY_OVERHEAD];
            }
            //强制 fullGC,回收所有 TLAB
            whiteBox.fullGC();
            //分配对象,大小100KB
            for (int i = 1; i < 500; ++i) {
                tmp = new byte[OBJECT_SIZE * 100 - BYTE_ARRAY_OVERHEAD];
            }
            whiteBox.fullGC();
            //阻塞程序,保证所有日志输出完
            Thread.currentThread().join();
        }
之后,我们以如下的启动参数(前三个启动参数是我们前面章节提到的启用 WhiteBox API 需要的参数)启动这个程序,查看日志(关于日志配置,请参考之前的章节)。
    -Xbootclasspath/a:./jdk-white-box-17.0-SNAPSHOT.jar
    -XX:+UnlockDiagnosticVMOptions
    -XX:+WhiteBoxAPI
    -Xms512m
    -Xmx512m
    -XX:+UseTLAB
    -Xlog:gc+tlab=trace
    -Xlog:gc
可以看到下面类似的日志,我们来根据代码分析下,首先是运行到第一个 fullGC 结束之前的所有日志,首先是 JVM 启动的时候会输出用的是什么 GC 的日志,这里是默认的 G1:
[0.022s][info][gc] Using G1
还会输出 TLAB 的通用配置:
[0.030s][trace][gc,tlab] TLAB min: 328 initial: 60293 max: 65536
也就是这里 TLAB 最小为 328 MarkWordSize,初始为 60293 MarkWordSize,最大为 65536 MarkWordSize。默认的 64位 JVM 的 MarkWordSize 为 8 字节,也就是堆内存 8 字节对齐。
然后,由于 JVM 启动时,默认会初始化很多线程,包括:
- main 线程 :执行 main 方法的线程
- Attach listener 线程 :Attach Listener 线程是负责接收到外部的命令,而对该命令进行执行的并且把结果返回给发送者。通常我们会用一些命令去要求jvm给我们一些反馈信息,如:java -version、jmap、jstack等等。 如果该线程在jvm启动的时候没有初始化,那么,则会在用户第一次执行jvm命令时,得到启动。
- Signal Dispatcher线程 :Attach Listener线程的职责是接收外部jvm命令,当命令接收成功后,会交给signal dispather 线程去进行分发到各个不同的模块处理命令,并且返回处理结果。 signal dispather线程也是在第一次接收外部jvm命令时,进行初始化工作。
- Reference Handler 线程 :JVM在创建main线程后就创建Reference Handler线程,它主要用于处理引用对象本身(软引用、弱引用、虚引用)的垃圾回收问题 。
- Finalizer线程 :这个线程也是在main线程之后创建的,主要用于在垃圾收集前,调用对象的finalize()方法。
- DestroyJavaVM线程 :执行main()的线程在main执行完后调用JNI中的 jni_DestroyJavaVM() 方法唤起DestroyJavaVM 线程,它将在虚拟机中所有其它非守护线程全部结束后销毁虚拟机。
在运行过程中,根据你的JIT编译配置,GC参数,还会有:
- CompilerThread 线程 :JIT编译相关线程,主要是负责 C1 C2 即时编译以及 OSR(On stack Replacement) 替换等任务
- GC 相关线程 :执行GC任务的线程
除了这些之外,Java 8 之后 ForkJoinPool 还会创建一个默认大小为 cpu 核数 -1 的线程池: CommonForkJoinPool ,是用来处理 ParallelStream 的默认线程池还有 Future 框架 CompletableFuture 的默认线程池。
这些线程中的一部分会在 JVM 初始化的时候创建一些对象使用,那么就肯定会涉及到 TLAB,所以会有如下日志:
    [0.042s][trace][gc,tlab] ThreadLocalAllocBuffer::compute_size(2) returns 65536
    [0.042s][trace][gc,tlab] TLAB: fill thread: 0x000002a66a471710 [id: 12916] desired_size: 512KB slow allocs: 0  refill waste: 8192B alloc: 1.00000     1024KB refills: 1 waste  0.0% gc: 0B slow: 0B fast: 0B
    [0.155s][trace][gc,tlab] ThreadLocalAllocBuffer::compute_size(25) returns 65536
    [0.155s][trace][gc,tlab] TLAB: fill thread: 0x000002a60028e900 [id: 15380] desired_size: 512KB slow allocs: 0  refill waste: 8192B alloc: 1.00000     1024KB refills: 1 waste  0.0% gc: 0B slow: 0B fast: 0B
    [0.340s][trace][gc,tlab] ThreadLocalAllocBuffer::compute_size(2) returns 256
    [0.340s][trace][gc,tlab] TLAB: fill thread: 0x000002a66a471710 [id: 12916] desired_size: 512KB slow allocs: 0  refill waste: 8192B alloc: 1.00000     2048KB refills: 2 waste  0.1% gc: 0B slow: 576B fast: 0B


    //省略其他线程的 TLAB 日志,这里 23480 是 Main 线程。读者可以通过程序输出日志中执行循环分配对象的线程 TLAB 日志判断哪一个是 Main 线程
其中,[0.042s][trace][gc,tlab] ThreadLocalAllocBuffer::compute_size(2) returns 65536的对应的就是调用了compute_size计算初始 TLAB 大小,传入的 2 就是当前这个线程分配的对象所需的大小(MarkWordSize),计算出初始大小为 65536,因为 MarkWordSize = 8 所以 就是 65536*8=524288 字节,也就是 512 KB。下一行日志,代表这个线程初始化申请一块内存作为 TLAB 了,[0.042s][trace][gc,tlab] TLAB: fill thread: 0x000002a66a471710 [id: 12916] desired_size: 512KB slow allocs: 0 refill waste: 8192B alloc: 1.00000 1024KB refills: 1 waste 0.0% gc: 0B slow: 0B fast: 0B,这个 TLAB 的信息包括:
- 线程号
0x000002a66a471710 [id: 12916] - 期望大小,就是刚刚计算出来的 512KB:
desired_size: 512KB - 慢分配次数,就是不在当前 TLAB 直接分配的分配次数:
slow allocs: 0 - 当前浪费空间限制,也就是重新申请 TLAB 造成的浪费限制大小,refill waste: 8192B,也就是最多能浪费 8192 字节
- 当前 _allocation_fraction 相关信息,
alloc: 1.00000 1024KB,代表当前 _allocation_fraction 是 1.00000,TLAB 一共用了 1024 KB - 发生 refills 重新申请 TLAB 的次数:
refills: 1 - 浪费比例:
waste 0.0% - GC 回收造成的浪费大小:
gc: 0B - 慢
refill造成的浪费:slow: 0B - 快
refill造成的浪费:fast: 0B
我们这里来计算下 为何当前浪费空间为 8192 字节 ,也就是 8KB。TLABRefillWasteFraction 我们并没有修改,也就是默认的 64,那么初始的最大浪费空间 = TLAB 大小 / TLABRefillWasteFraction,也就是 512KB / 64 = 8KB
第一次强制 FullGC 之后,看到如下相关日志:
    //首先输出了每一个线程的当前 TLAB 的信息
    [0.915s][trace][gc,tlab] GC(0) TLAB: gc thread: 0x000002a66a471710 [id: 12916] desired_size: 512KB slow allocs: 0  refill waste: 8192B alloc: 1.00000     8192KB refills: 15 waste  7.1% gc: 360616B slow: 13880B fast: 0B
    [0.915s][trace][gc,tlab] GC(0) TLAB: gc thread: 0x000002a60028d180 [id: 24604] desired_size: 512KB slow allocs: 0  refill waste: 8192B alloc: 1.00000     8192KB refills: 0 waste  0.0% gc: 0B slow: 0B fast: 0B
    [0.915s][trace][gc,tlab] GC(0) TLAB: gc thread: 0x000002a60028e900 [id: 15380] desired_size: 512KB slow allocs: 0  refill waste: 8192B alloc: 1.00000     8192KB refills: 1 waste 99.9% gc: 524008B slow: 0B fast: 0B
    [0.915s][trace][gc,tlab] GC(0) TLAB: gc thread: 0x000002a6002dc380 [id: 10316] desired_size: 512KB slow allocs: 0  refill waste: 8192B alloc: 1.00000     8192KB refills: 0 waste  0.0% gc: 0B slow: 0B fast: 0B
    [0.915s][trace][gc,tlab] GC(0) TLAB: gc thread: 0x000002a600319040 [id: 3856] desired_size: 512KB slow allocs: 0  refill waste: 8192B alloc: 1.00000     8192KB refills: 0 waste  0.0% gc: 0B slow: 0B fast: 0B
    [0.915s][trace][gc,tlab] GC(0) TLAB: gc thread: 0x000002a60031a1f0 [id: 16808] desired_size: 512KB slow allocs: 0  refill waste: 8192B alloc: 1.00000     8192KB refills: 0 waste  0.0% gc: 0B slow: 0B fast: 0B
    [0.915s][trace][gc,tlab] GC(0) TLAB: gc thread: 0x000002a600326970 [id: 292] desired_size: 512KB slow allocs: 0  refill waste: 8192B alloc: 1.00000     8192KB refills: 0 waste  0.0% gc: 0B slow: 0B fast: 0B
    [0.915s][trace][gc,tlab] GC(0) TLAB: gc thread: 0x000002a600328620 [id: 10932] desired_size: 512KB slow allocs: 0  refill waste: 8192B alloc: 1.00000     8192KB refills: 0 waste  0.0% gc: 0B slow: 0B fast: 0B
    [0.915s][trace][gc,tlab] GC(0) TLAB: gc thread: 0x000002a60032ac90 [id: 14528] desired_size: 512KB slow allocs: 0  refill waste: 8192B alloc: 1.00000     8192KB refills: 1 waste 99.8% gc: 521328B slow: 0B fast: 0B
    [0.915s][trace][gc,tlab] GC(0) TLAB: gc thread: 0x000002a600343ec0 [id: 20040] desired_size: 512KB slow allocs: 0  refill waste: 8192B alloc: 1.00000     8192KB refills: 0 waste  0.0% gc: 0B slow: 0B fast: 0B
    [0.915s][trace][gc,tlab] GC(0) TLAB: gc thread: 0x000002a600ca03f0 [id: 14304] desired_size: 512KB slow allocs: 0  refill waste: 8192B alloc: 1.00000     8192KB refills: 0 waste  0.0% gc: 0B slow: 0B fast: 0B
    [0.915s][trace][gc,tlab] GC(0) TLAB: gc thread: 0x000002a600e157e0 [id: 24148] desired_size: 512KB slow allocs: 0  refill waste: 8192B alloc: 1.00000     8192KB refills: 1 waste 60.9% gc: 1248B slow: 0B fast: 0B
    [0.915s][trace][gc,tlab] GC(0) TLAB: gc thread: 0x000002a600f17090 [id: 13736] desired_size: 512KB slow allocs: 0  refill waste: 8192B alloc: 1.00000     8192KB refills: 1 waste 99.9% gc: 523976B slow: 0B fast: 0B
    [0.915s][trace][gc,tlab] GC(0) TLAB: gc thread: 0x000002a600f0e850 [id: 19208] desired_size: 512KB slow allocs: 0  refill waste: 8192B alloc: 1.00000     8192KB refills: 1 waste 99.9% gc: 521688B slow: 0B fast: 0B
    [0.915s][trace][gc,tlab] GC(0) TLAB: gc thread: 0x000002a601381710 [id: 9804] desired_size: 512KB slow allocs: 0  refill waste: 8192B alloc: 1.00000     8192KB refills: 0 waste  0.0% gc: 0B slow: 0B fast: 0B
    [0.915s][trace][gc,tlab] GC(0) TLAB: gc thread: 0x000002a6013aef00 [id: 23640] desired_size: 512KB slow allocs: 0  refill waste: 8192B alloc: 1.00000     8192KB refills: 0 waste  0.0% gc: 0B slow: 0B fast: 0B
    [0.915s][trace][gc,tlab] GC(0) TLAB: gc thread: 0x000002a6013f7650 [id: 1860] desired_size: 512KB slow allocs: 0  refill waste: 8192B alloc: 1.00000     8192KB refills: 0 waste  0.0% gc: 0B slow: 0B fast: 0B
    [0.915s][trace][gc,tlab] GC(0) TLAB: gc thread: 0x000002a601ad77b0 [id: 17292] desired_size: 512KB slow allocs: 0  refill waste: 8192B alloc: 1.00000     8192KB refills: 1 waste 99.9% gc: 521752B slow: 0B fast: 0B
    [0.915s][trace][gc,tlab] GC(0) TLAB: gc thread: 0x000002a601971200 [id: 17448] desired_size: 512KB slow allocs: 0  refill waste: 8192B alloc: 1.00000     8192KB refills: 0 waste  0.0% gc: 0B slow: 0B fast: 0B
    [0.915s][trace][gc,tlab] GC(0) TLAB: gc thread: 0x000002a601972220 [id: 11844] desired_size: 512KB slow allocs: 0  refill waste: 8192B alloc: 1.00000     8192KB refills: 0 waste  0.0% gc: 0B slow: 0B fast: 0B
    [0.915s][trace][gc,tlab] GC(0) TLAB: gc thread: 0x000002a601705560 [id: 7832] desired_size: 512KB slow allocs: 0  refill waste: 8192B alloc: 1.00000     8192KB refills: 0 waste  0.0% gc: 0B slow: 0B fast: 0B
    //GC TLAB 统计
    [0.915s][debug][gc,tlab] GC(0) TLAB totals: thrds: 7  refills: 21 max: 15 slow allocs: 0 max 0 waste: 38.0% gc: 2974616B max: 524008B slow: 13880B max: 13880B fast: 0B max: 0B
    //每个线程 TLAB 期望大小的变化
    [0.979s][trace][gc,tlab] GC(0) TLAB new size: thread: 0x000002a66a471710 [id: 12916] refills 50  alloc: 1.000000 desired_size: 65536 -> 65536
    [0.979s][trace][gc,tlab] GC(0) TLAB new size: thread: 0x000002a60028d180 [id: 24604] refills 50  alloc: 1.000000 desired_size: 65536 -> 65536
    [0.979s][trace][gc,tlab] GC(0) TLAB new size: thread: 0x000002a60028e900 [id: 15380] refills 50  alloc: 1.000000 desired_size: 65536 -> 65536
    [0.979s][trace][gc,tlab] GC(0) TLAB new size: thread: 0x000002a6002dc380 [id: 10316] refills 50  alloc: 1.000000 desired_size: 65536 -> 65536
    [0.979s][trace][gc,tlab] GC(0) TLAB new size: thread: 0x000002a600319040 [id: 3856] refills 50  alloc: 1.000000 desired_size: 65536 -> 65536
    [0.979s][trace][gc,tlab] GC(0) TLAB new size: thread: 0x000002a60031a1f0 [id: 16808] refills 50  alloc: 1.000000 desired_size: 65536 -> 65536
    [0.979s][trace][gc,tlab] GC(0) TLAB new size: thread: 0x000002a600326970 [id: 292] refills 50  alloc: 1.000000 desired_size: 65536 -> 65536
    [0.979s][trace][gc,tlab] GC(0) TLAB new size: thread: 0x000002a600328620 [id: 10932] refills 50  alloc: 1.000000 desired_size: 65536 -> 65536
    [0.979s][trace][gc,tlab] GC(0) TLAB new size: thread: 0x000002a60032ac90 [id: 14528] refills 50  alloc: 1.000000 desired_size: 65536 -> 65536
    [0.979s][trace][gc,tlab] GC(0) TLAB new size: thread: 0x000002a600343ec0 [id: 20040] refills 50  alloc: 1.000000 desired_size: 65536 -> 65536
    [0.979s][trace][gc,tlab] GC(0) TLAB new size: thread: 0x000002a600ca03f0 [id: 14304] refills 50  alloc: 1.000000 desired_size: 65536 -> 65536
    [0.979s][trace][gc,tlab] GC(0) TLAB new size: thread: 0x000002a600e157e0 [id: 24148] refills 50  alloc: 1.000000 desired_size: 65536 -> 65536
    [0.979s][trace][gc,tlab] GC(0) TLAB new size: thread: 0x000002a600f17090 [id: 13736] refills 50  alloc: 1.000000 desired_size: 65536 -> 65536
    [0.980s][trace][gc,tlab] GC(0) TLAB new size: thread: 0x000002a600f0e850 [id: 19208] refills 50  alloc: 1.000000 desired_size: 65536 -> 65536
    [0.980s][trace][gc,tlab] GC(0) TLAB new size: thread: 0x000002a601381710 [id: 9804] refills 50  alloc: 1.000000 desired_size: 65536 -> 65536
    [0.980s][trace][gc,tlab] GC(0) TLAB new size: thread: 0x000002a6013aef00 [id: 23640] refills 50  alloc: 1.000000 desired_size: 65536 -> 65536
    [0.980s][trace][gc,tlab] GC(0) TLAB new size: thread: 0x000002a6013f7650 [id: 1860] refills 50  alloc: 1.000000 desired_size: 65536 -> 65536
    [0.980s][trace][gc,tlab] GC(0) TLAB new size: thread: 0x000002a601ad77b0 [id: 17292] refills 50  alloc: 1.000000 desired_size: 65536 -> 65536
    [0.980s][trace][gc,tlab] GC(0) TLAB new size: thread: 0x000002a601971200 [id: 17448] refills 50  alloc: 1.000000 desired_size: 65536 -> 65536
    [0.980s][trace][gc,tlab] GC(0) TLAB new size: thread: 0x000002a601972220 [id: 11844] refills 50  alloc: 1.000000 desired_size: 65536 -> 65536
    [0.980s][trace][gc,tlab] GC(0) TLAB new size: thread: 0x000002a601705560 [id: 7832] refills 50  alloc: 1.000000 desired_size: 65536 -> 65536
    //GC 信息
    [0.980s][info ][gc     ] GC(0) Pause Full (WhiteBox Initiated Full GC) 7M->0M(512M) 65.162ms
首先是输出了每一个线程的当前 TLAB 的信息。与前面发生 refill 分配 TLAB 时相似。只不过多了 GC 全局序号,从 0 开始, GC(0) 代表的就是第一次 GC 相关的日志
然后是 GC TLAB 统计:[0.915s][debug][gc,tlab] GC(0) TLAB totals: thrds: 7 refills: 21 max: 15 slow allocs: 0 max 0 waste: 38.0% gc: 2974616B max: 524008B slow: 13880B max: 13880B fast: 0B max: 0B:
- 一共有7个线程用了 TLAB:
thrds: 7,也就是前面带GC(0)的 TLAB 信息日志中,只有 7 个线程的 refills 是大于 0 的。 - 本次 GC 所有线程 refills 的次数
refills: 21 - 历史最大的某次 GC 内 refills 的次数
max: 15 - 本次 GC 所有线程慢分配的次数
slow allocs: 0 - 历史最大的某次 GC 内慢分配的次数
max: 0 - 本次 GC 所有线程 TLAB 内存浪费比例
waste: 38.0% - 各种浪费内存大小:`gc: 2974616B max: 524008B slow: 13880B max: 13880B fast: 0B max: 0B``
接着打印了每个线程 TLAB 期望大小的变化:[0.979s][trace][gc,tlab] GC(0) TLAB new size: thread: 0x000002a66a471710 [id: 12916] refills 50 alloc: 1.000000 desired_size: 65536 -> 65536,这里还是 MarkWordSize 而不是实际字节大小。
最后是本次 GC 信息:[0.980s][info ][gc ] GC(0) Pause Full (WhiteBox Initiated Full GC) 7M->0M(512M) 65.162ms,代表是 FullGC,并且是 WhiteBox 触发的,堆内存使用从 7M 回收到了 0M,堆内存总大小是 512M,一共停顿时间是 65.162 ms。
之后我们的程序申请了 512 个大小为 1KB 的对象。为何new byte[OBJECT_SIZE - BYTE_ARRAY_OVERHEAD]大小是 1KB 呢?因为数组对象头默认是 16 字节,所以再加上 1012 个 byte 就是 1KB。循环结束后,输出了下面两行日志:
    [0.989s][trace][gc,tlab] ThreadLocalAllocBuffer::compute_size(128) returns 65536
    [0.989s][trace][gc,tlab] TLAB: fill thread: 0x000002a66a471710 [id: 12916] desired_size: 512KB slow allocs: 0  refill waste: 8192B alloc: 1.00000     1024KB refills: 1 waste  0.0% gc: 0B slow: 0B fast: 0B
    [0.989s][trace][gc,tlab] ThreadLocalAllocBuffer::compute_size(128) returns 65536
    [0.989s][trace][gc,tlab] TLAB: fill thread: 0x000002a66a471710 [id: 12916] desired_size: 512KB slow allocs: 0  refill waste: 8192B alloc: 1.00000     1024KB refills: 2 waste  0.1% gc: 0B slow: 1024B fast: 0B
可以看出是发生了两次 refill,第一次是线程第一次创建对象时申请的,第二次是申请到第 512 个对象,TLAB 大小是 512 KB,之前的 511KB 已经被占用了,根据前一篇的 TLAB 原理分析,我们知道由于需要填充 dummy objects 所以要保留一个数组对象头的大小,所以 剩下可分配的空间其实不足 1KB ,所以需要 refill。并且, 浪费的空间(1KB)小于当前浪费空间限制(8KB),所以可以重新申请新的 TLAB 进行分配 。
然后我们的程序在 FullGC 之后,继续申请了 200 个大小为 100KB 的大对象。这里我们忽略 GC 相关日志,只看分配对象的时候产生的日志。
    [3036.734s][trace][gc,tlab] ThreadLocalAllocBuffer::compute_size(12800) returns 65536
    [3036.734s][trace][gc,tlab] TLAB: fill thread: 0x000002a66a471710 [id: 12916] desired_size: 512KB slow allocs: 0  refill waste: 8192B alloc: 1.00000     1024KB refills: 1 waste  0.0% gc: 0B slow: 0B fast: 0B
    [3047.276s][trace][gc,tlab] TLAB: slow thread: 0x000002a66a471710 [id: 12916] obj: 12800 free: 1464 waste: 1028
    [3047.276s][trace][gc,tlab] TLAB: slow thread: 0x000002a66a471710 [id: 12916] obj: 12800 free: 1464 waste: 1032
    [3047.276s][trace][gc,tlab] TLAB: slow thread: 0x000002a66a471710 [id: 12916] obj: 12800 free: 1464 waste: 1036
    [3047.276s][trace][gc,tlab] TLAB: slow thread: 0x000002a66a471710 [id: 12916] obj: 12800 free: 1464 waste: 1040
    [3047.276s][trace][gc,tlab] TLAB: slow thread: 0x000002a66a471710 [id: 12916] obj: 12800 free: 1464 waste: 1044
    [3047.276s][trace][gc,tlab] TLAB: slow thread: 0x000002a66a471710 [id: 12916] obj: 12800 free: 1464 waste: 1048
    //省略中间分配日志。。。
    [3047.279s][trace][gc,tlab] TLAB: slow thread: 0x000002a66a471710 [id: 12916] obj: 12800 free: 1464 waste: 1452
    [3047.279s][trace][gc,tlab] TLAB: slow thread: 0x000002a66a471710 [id: 12916] obj: 12800 free: 1464 waste: 1456
    [3047.279s][trace][gc,tlab] TLAB: slow thread: 0x000002a66a471710 [id: 12916] obj: 12800 free: 1464 waste: 1460
    [3047.279s][trace][gc,tlab] TLAB: slow thread: 0x000002a66a471710 [id: 12916] obj: 12800 free: 1464 waste: 1464
    [3047.279s][trace][gc,tlab] ThreadLocalAllocBuffer::compute_size(12800) returns 65536
    [3047.279s][trace][gc,tlab] TLAB: fill thread: 0x000002a66a471710 [id: 12916] desired_size: 512KB slow allocs: 110  refill waste: 11712B alloc: 1.00000    13312KB refills: 2 waste  1.2% gc: 0B slow: 12288B fast: 0B
    [3047.279s][trace][gc,tlab] TLAB: slow thread: 0x000002a66a471710 [id: 12916] obj: 12800 free: 1464 waste: 1028
    [3047.279s][trace][gc,tlab] TLAB: slow thread: 0x000002a66a471710 [id: 12916] obj: 12800 free: 1464 waste: 1032
    [3047.279s][trace][gc,tlab] TLAB: slow thread: 0x000002a66a471710 [id: 12916] obj: 12800 free: 1464 waste: 1036
    [3047.279s][trace][gc,tlab] TLAB: slow thread: 0x000002a66a471710 [id: 12916] obj: 12800 free: 1464 waste: 1040
    //省略中间分配日志。。。
    [3047.281s][trace][gc,tlab] TLAB: slow thread: 0x000002a66a471710 [id: 12916] obj: 12800 free: 1464 waste: 1340
100KB 的对象,换算成 MarkWordSize 就是 12800 ,对应日志:[3036.734s][trace][gc,tlab] ThreadLocalAllocBuffer::compute_size(12800) returns 65536,本次计算 TLAB 大小依然是 65536 MarkWordSize,也就是 512KB。在分配 第五个 对象开始, TLAB 的剩余内存就不够了。但是初始最大浪费空间是 8KB,所以只能直接在 Eden 区分配,并根据 TLABWasteIncrement(默认为 4) 设置的值递增最大浪费空间,也就是每次递增 4 * MarkWordSize 也就是 32 字节。体现在了日志:
    [3047.276s][trace][gc,tlab] TLAB: slow thread: 0x000002a66a471710 [id: 12916] obj: 12800 free: 1464 waste: 1028
    [3047.276s][trace][gc,tlab] TLAB: slow thread: 0x000002a66a471710 [id: 12916] obj: 12800 free: 1464 waste: 1032
    [3047.276s][trace][gc,tlab] TLAB: slow thread: 0x000002a66a471710 [id: 12916] obj: 12800 free: 1464 waste: 1036
    [3047.276s][trace][gc,tlab] TLAB: slow thread: 0x000002a66a471710 [id: 12916] obj: 12800 free: 1464 waste: 1040
可以看出,每次 TLAB 外分配都让 最大浪费空间限制加 4 。当剩余空间小于最大浪费空间限制时,线程 refill 申请了一块新的 TLAB 进行分配:
    [3047.279s][trace][gc,tlab] TLAB: slow thread: 0x000002a66a471710 [id: 12916] obj: 12800 free: 1464 waste: 1456
    [3047.279s][trace][gc,tlab] TLAB: slow thread: 0x000002a66a471710 [id: 12916] obj: 12800 free: 1464 waste: 1460
    [3047.279s][trace][gc,tlab] TLAB: slow thread: 0x000002a66a471710 [id: 12916] obj: 12800 free: 1464 waste: 1464
    [3047.279s][trace][gc,tlab] ThreadLocalAllocBuffer::compute_size(12800) returns 65536
    [3047.279s][trace][gc,tlab] TLAB: fill thread: 0x000002a66a471710 [id: 12916] desired_size: 512KB slow allocs: 110  refill waste: 11712B alloc: 1.00000    13312KB refills: 2 waste  1.2% gc: 0B slow: 12288B fast: 0B
至此,我们就分析了基本所有 TLAB 相关的日志。
Java 面试宝典是大明哥全力打造的 Java 精品面试题,它是一份靠谱、强大、详细、经典的 Java 后端面试宝典。它不仅仅只是一道道面试题,而是一套完整的 Java 知识体系,一套你 Java 知识点的扫盲贴。
它的内容包括:
- 大厂真题:Java 面试宝典里面的题目都是最近几年的高频的大厂面试真题。
- 原创内容:Java 面试宝典内容全部都是大明哥原创,内容全面且通俗易懂,回答部分可以直接作为面试回答内容。
- 持续更新:一次购买,永久有效。大明哥会持续更新 3+ 年,累计更新 1000+,宝典会不断迭代更新,保证最新、最全面。
- 覆盖全面:本宝典累计更新 1000+,从 Java 入门到 Java 架构的高频面试题,实现 360° 全覆盖。
- 不止面试:内容包含面试题解析、内容详解、知识扩展,它不仅仅只是一份面试题,更是一套完整的 Java 知识体系。
- 宝典详情:https://www.yuque.com/chenssy/sike-java/xvlo920axlp7sf4k
- 宝典总览:https://www.yuque.com/chenssy/sike-java/yogsehzntzgp4ly1
- 宝典进展:https://www.yuque.com/chenssy/sike-java/en9ned7loo47z5aw
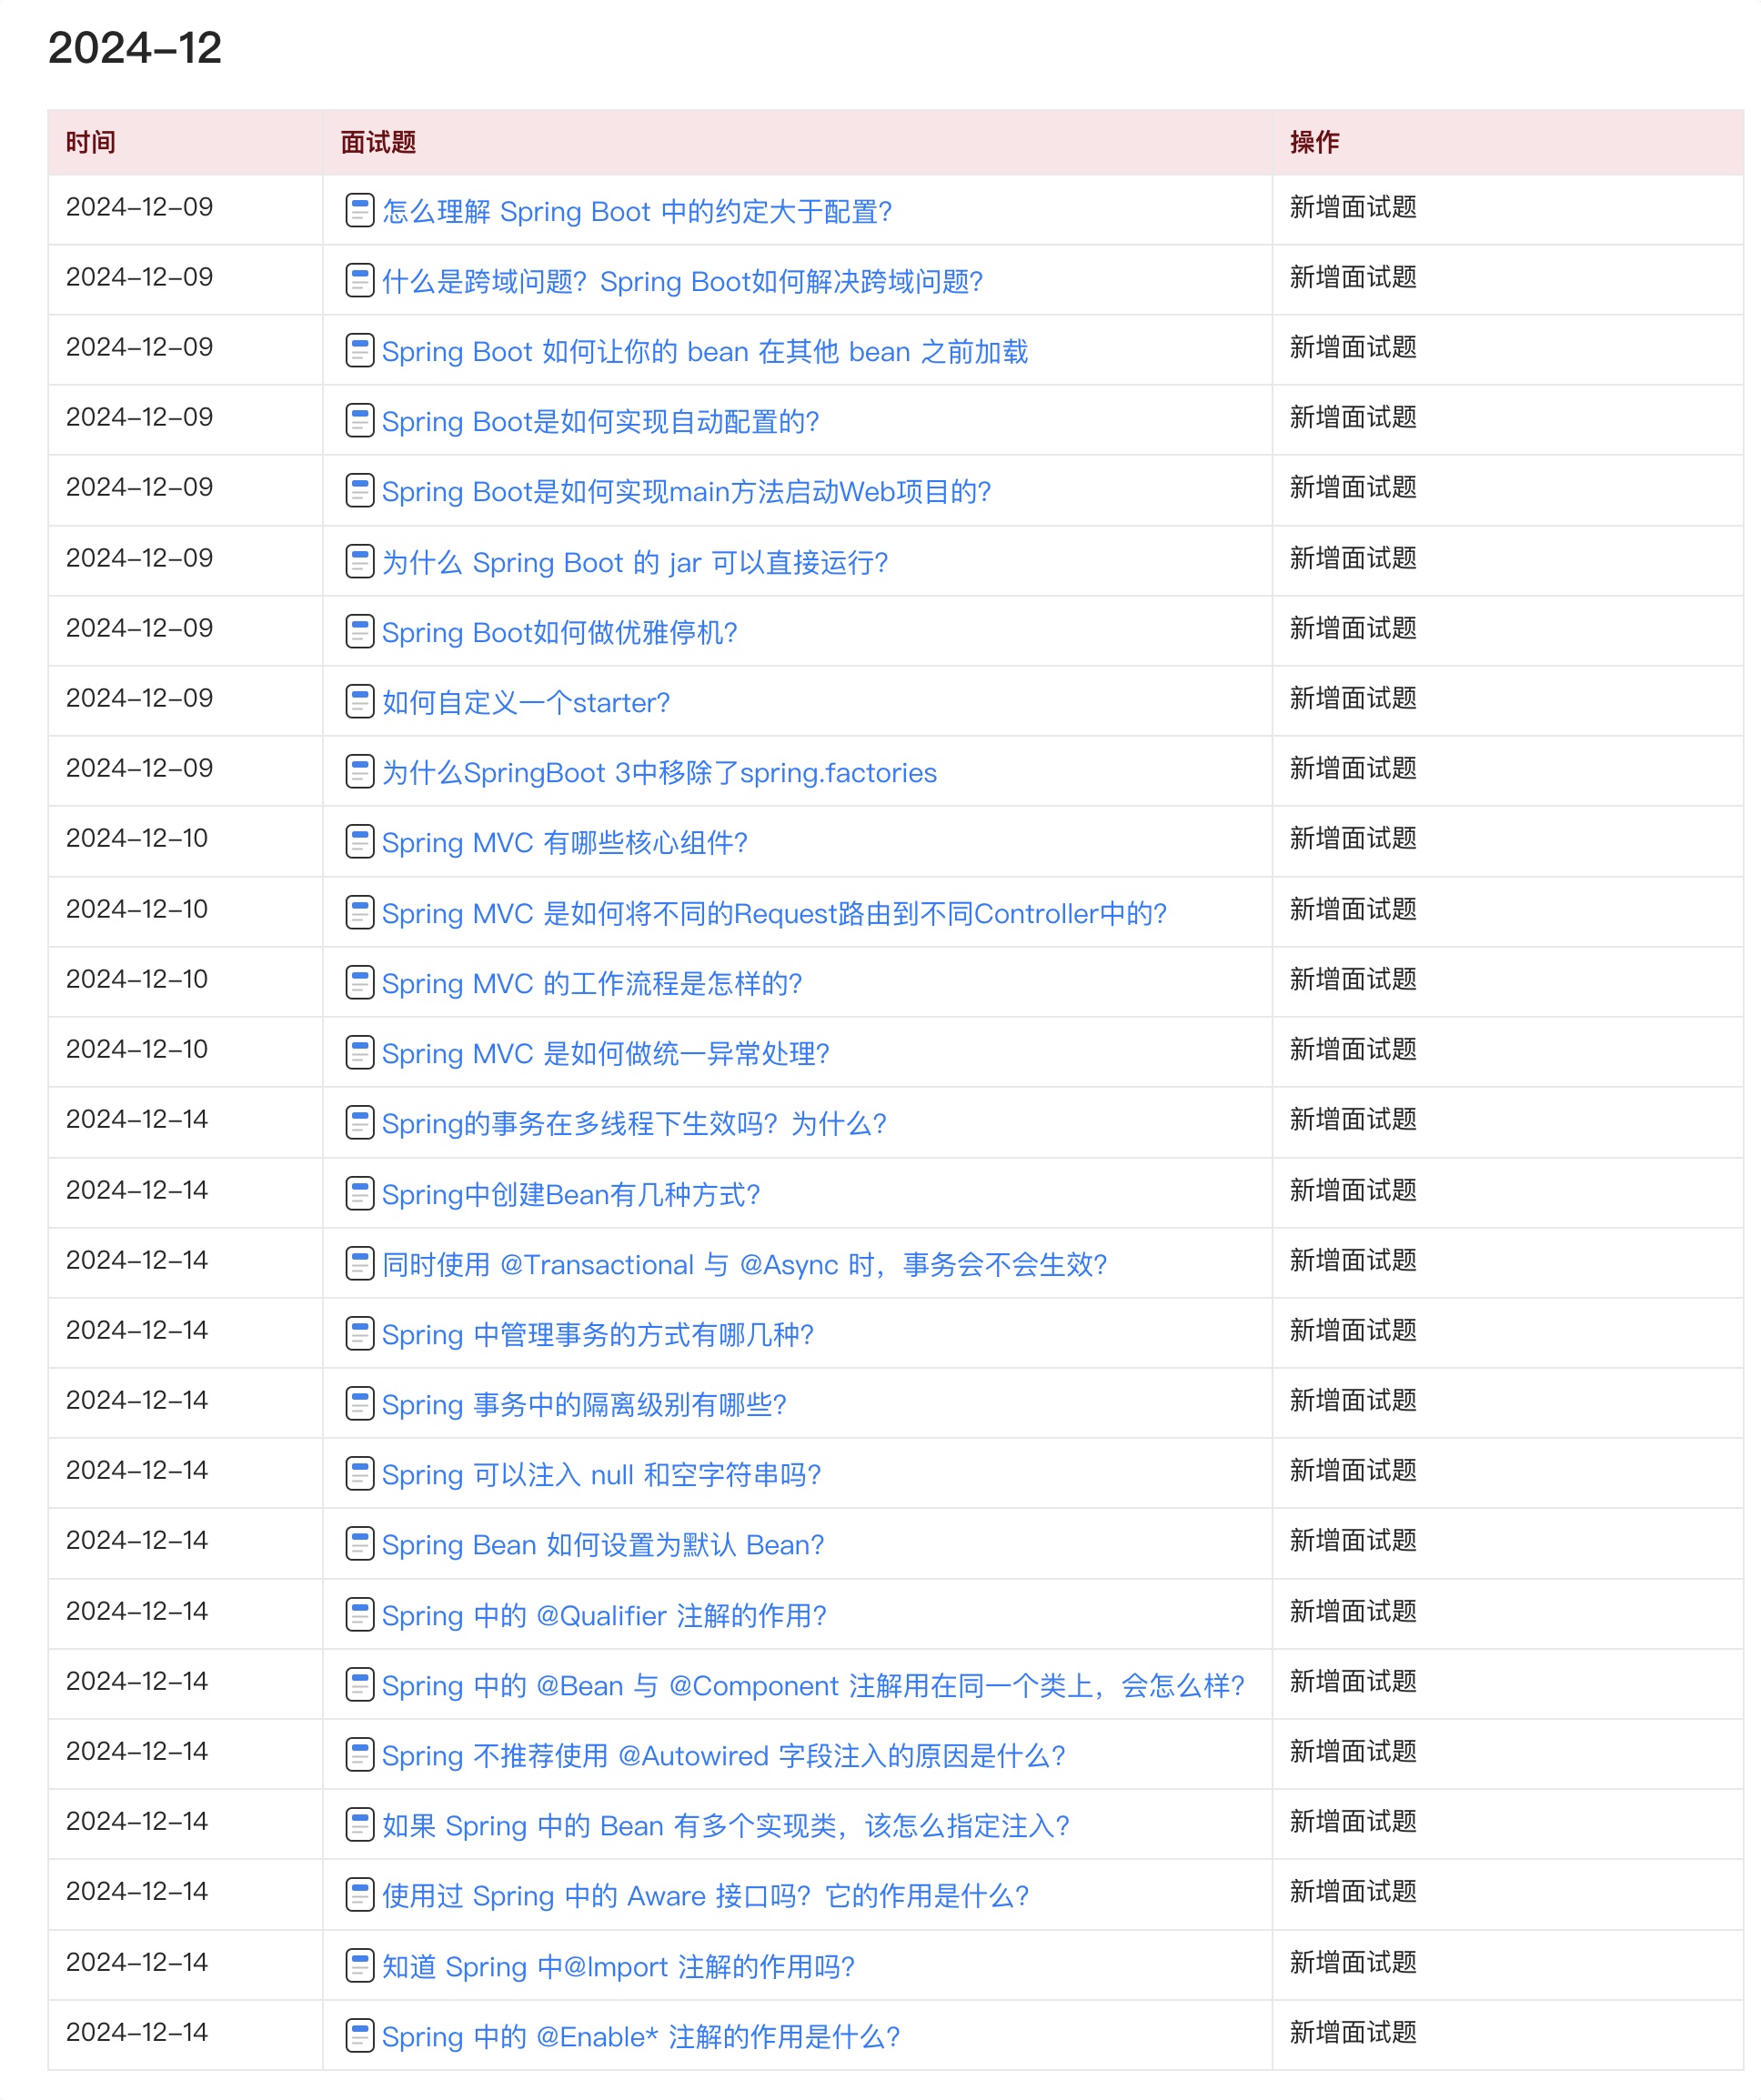
目前 Java 面试宝典累计更新 400+ 道,总字数 42w+。大明哥还在持续更新中,下图是大明哥在 2024-12 月份的更新情况:
想了解详情的小伙伴,扫描下面二维码加大明哥微信【daming091】咨询

同时,大明哥也整理一套目前市面最常见的热点面试题。微信搜[大明哥聊 Java]或扫描下方二维码关注大明哥的原创公众号[大明哥聊 Java] ,回复【面试题】 即可免费领取。